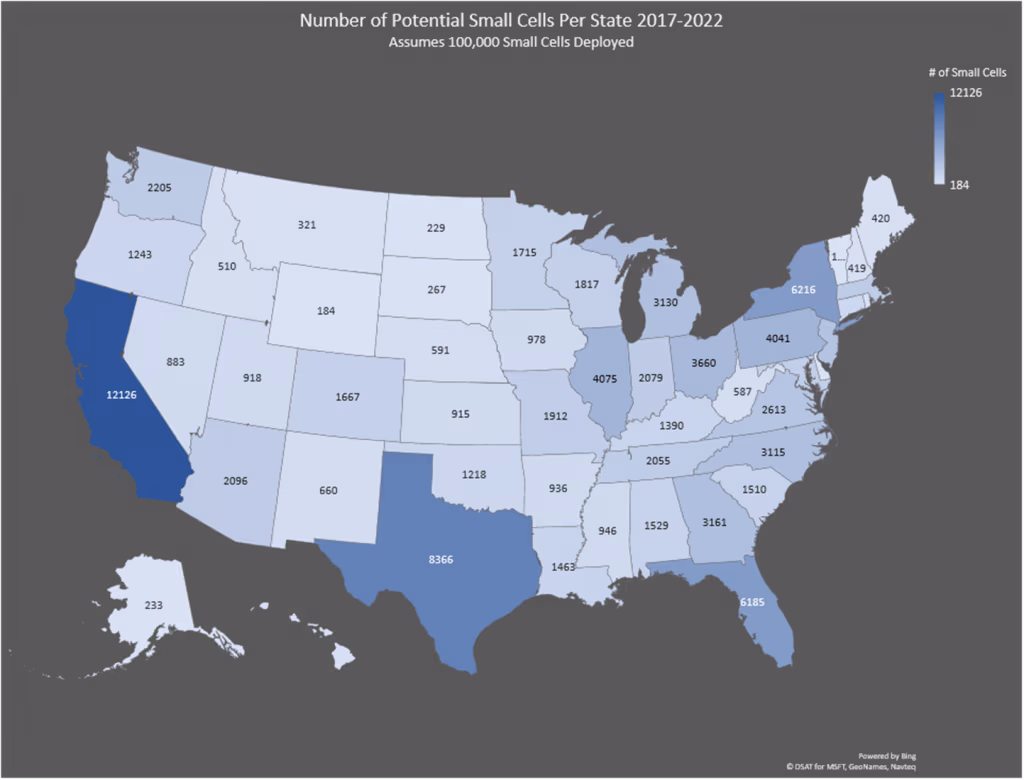
To show the impact of 100,000 small cells being deployed in the US over the next few years, we looked at total population per state and created this map which assumes that small cell deployment will follow population. In other words, a state’s relative population is used as a proxy for small cell need in this map. In reality, there are many more factors which will influence the number of small cells in each state.
These include:
- Population density
- Difficulty of procuring permits for macrocells
- Spectrum shortfalls in specific markets
- Competitive Pressure between Carriers
- Topography
Thus, this map is only intended as a rough estimate of small cells to be deployed by state. Where it gets interesting is when you assume that the actual number of small cells could be 1,000,000. Previous FCC Chair Tom Wheeler indicated in a 2016 speech that the number of small cells deployed “may reach into the millions”. Multiply the numbers in the map by 10 to see what we mean. The state of California alone could see 120,000 small cells with most in urban and suburban areas. That is a lot of small cells.