It’s been a dozen years since Verizon’s catchphrase “Can you hear me now?” became a commonplace precept for any mobile phone user having problems with a cellular connection. Since then, there has been a tremendous amount of industry activity regarding partnerships, mergers, acquisitions and dissolutions amongst wireless service providers. Today, there are now three major players in the U.S.; sometimes known as the “Big Three” Verizon, AT&T, and T-Mobile (who acquired Sprint) are the survivors who have staked claims to national airwaves and their respective licensed markets of POPs.
Since competition for subscribers remains at the forefront of Big 3 marketing strategies, and “anytime, anywhere” fast and reliable coverage is a benefit to many people, the major carriers publish network coverage maps on their websites, in an effort to persuade customers to churn their way. In the last two years, it’s become a matter of growing concern for some politicians who have taken the issue of accurate network coverage on as a rallying cry. Sen. Charles Schumer, D-NY, asked the FCC to investigate whether network providers are fairly and accurately advertising wireless coverage in their online coverage map tools.
CALL FOR BETTER COVERAGE MAPS
The FCC has been calling for better coverage maps (at the bequest of Congress) and has initiated a surprisingly aggressive attack on carrier coverage maps. However, the carriers are fighting back, saying that having to produce reliable coverage maps would be overly expensive due to the cost of drive testing. They allege that it would cost tens of millions per year to test just part of their coverage maps. (Ignoring the obvious possibilities that there are companies that already do nationwide drive testing who could drive the entire country for all wireless carriers simultaneously- thereby reducing the cost per carrier).
According to a study conducted by RootMetrics, Hudson Valley, NY ranks 125th out of 125 metropolitan areas for good coverage and capacity on the BIG 4 wireless networks. Now, it is important to acknowledge that many factors are contributing to strong wireless coverage and network capacity in a metropolitan area, some of which are completely outside of the WSP’s purview. For example, one factor is the willingness of local municipalities to allow wireless infrastructure, such as new tower builds. Under the Telecommunications Act of 1996, local municipalities could no longer prohibit the provision of wireless service. However, they sure can make it difficult. And in Hudson Valley, NY, zoning regulations do exactly that. Thus, it may not be AT&T, Sprint, T-Mobile or Verizon’s fault that coverage is poor in the Hudson Valley area. It isn’t for a lack of trying, as they get turned down in zoning hearings for new towers and wireless infrastructure on a regular basis. However, that doesn’t excuse them from inaccurately depicting strong coverage on their website coverage maps for that area.
Here at Steel in the Air, Inc., we review coverage maps for each of the wireless carriers on a daily basis, while acting as a cell tower lease expert that advises landowners of the fair-market value of leases. Part of our assessments involve a location metric, which enables us to determine the relative value of a particular location for each of the Big Three carriers, in consideration of their current operational infrastructure. Each year, my staff and I review thousands of locations and visit each wireless provider’s coverage map website for each newly proposed cell site location. Coverage maps are generated by either the marketing department or the radio frequency department, and are intended to fulfill specific purposes. In my opinion, both AT&T and Verizon have antiquated website coverage mapping tools that simply show equal coverage across large areas. While both AT&T and Verizon do have better coverage empirically (RootMetrics ranks them #1 and #2 across the United States), their coverage maps are simple marketing tools intended to convince viewers that coverage and capacity exists ubiquitously across a large area. T-Mobile recently (Aug-2020) reduced the quality of their coverage map in our opinion. Sprint (now part of T-Mobile) previously had more realistic coverage maps that show actual gradients in quality of coverage and more closely represent realistic conditions.
To illustrate, please see the image pair below. On the left is an image of Verizon’s coverage map depicting coverage strength in a given area. On the right is a coverage map that Verizon’s radio frequency department generated to support their efforts to get a new tower approved at the circled in the middle of the map. In order to get zoning approval to build a new tower, Verizon must demonstrate that its coverage is currently sub-par at that location. The blue areas represent strong coverage while the yellow areas represent weak to none. Again, the red map is what Verizon has published on its website illustrating the exact same area;
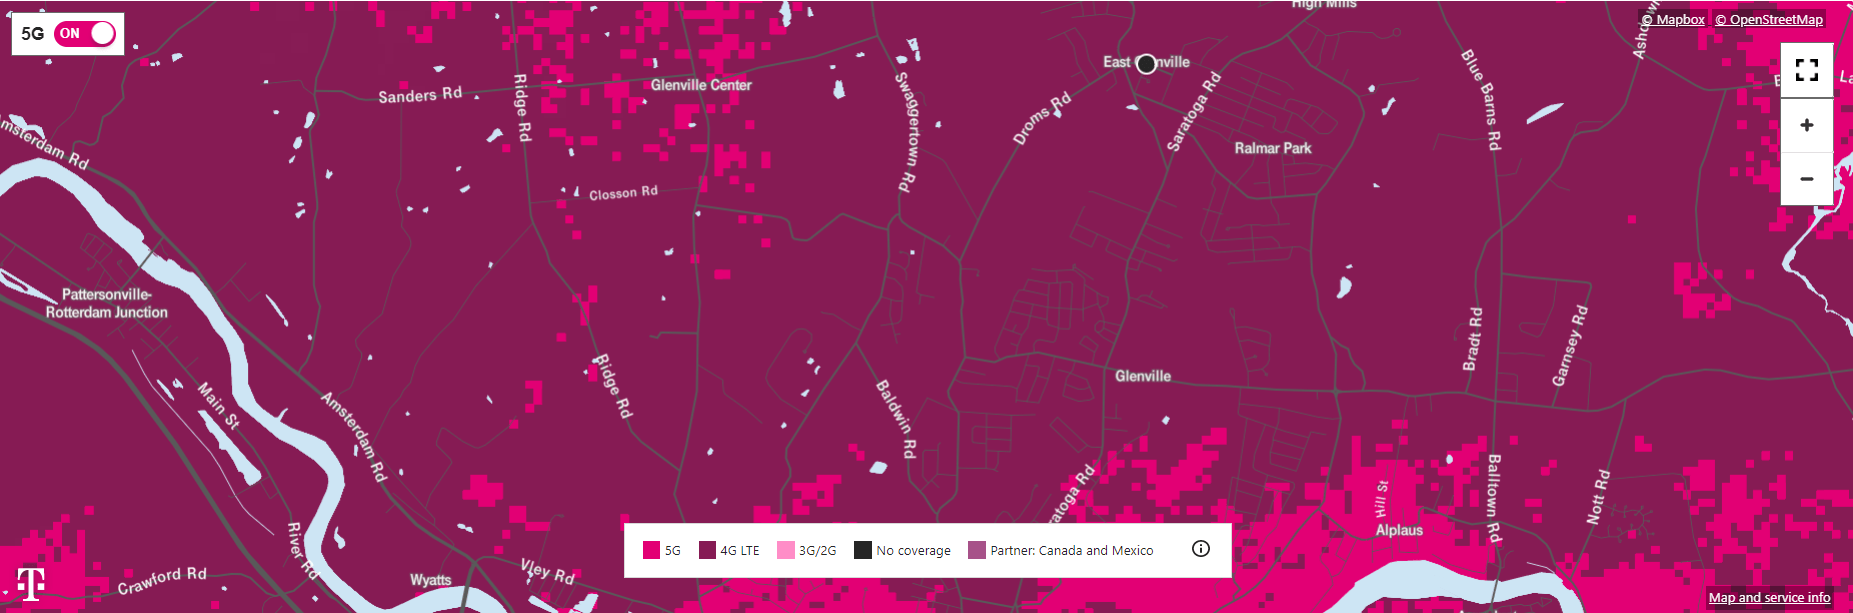
We previously gave T-Mobile credit for attempting to provide more actionable information with their coverage maps. In early 2015, T-Mobile’s coverage map was updated. The result was similar to AT&T and Verizon’s coverage map tools whereby most areas of the country were shown with excellent coverage. However, at some point in November of 2015, T-Mobile revised what their coverage maps showed to present more realistic results. To the right is a pair of images that illustrate coverage over the same area as shown on T-Mobile’s website on two different dates. The first, taken from June 18th of 2015, shows nearly complete strong coverage over the entire area. The second taken from November 15th of 2015 shows a different picture with pockets of strong coverage and some areas of weaker coverage. The latter map is much more representative of what T-Mobile’s coverage actually is, not what the marketing department wants to show it as. It appears that T-Mobile rightfully determined that they were overstating actual coverage and revised their map to more accurately show real coverage.
However, in August 2020, T-Mobile revised its coverage map yet again. The map now shows 5G availability but without any indication of the type of 5G that is is available or the quality/speed of that 5G. T-Mobile is now running 5G on three sets of spectrum: mmWave (fastest), 2.5GHz from Sprint (fast), and 600MHz (slower).
Although the maps now shown 5G availability, their 4G (dark maroon) maps may have been deprecated as the maps appear to show more universally available coverage in the same areas as before. This could be because they now have the Sprint sites and spectrum, but I tend to doubt it as it is unlikely that these areas have had Sprint sites converted to T-Mobile equipment yet. We suspect that T-Mobile made the decision to follow AT&T and Verizon’s lead and just show solid 4G coverage everywhere. Below is a August 24, 2020 coverage map showing the same area as in the T-Mobile coverage areas above. T-Mobile no longer shows “Excellent, Good or Average” coverage levels on their 4G map.
Coverage Map Accuracy
So you might ask “how would you rate the accuracy of the coverage maps by the Big 3 wireless carriers in terms of accuracy of actual coverage?” Here are our independent ratings of the quality of the coverage maps. It might be helpful to the reader to know that we maintain one of the best, if not the best, database of cell tower location data and lease rate data in the country. When we review the coverage maps, we also have the benefit of knowing where the towers are in the same area and, in many cases, which wireless carriers are located on which towers. We also know when there are no towers in an area where the wireless carrier may be stating (or exaggerating) that they have coverage. Below are our coverage map ratings based upon accuracy (the probability that the stated coverage accurately shows the actual coverage); ease of use (how easy is it to find the coverage map and use it); underlying map detail (how complete is the underlying road and map features; Ability to Select Device (does the website allow you to choose the device to see whether it has better/worse coverage); and Verified Coverage (does the map show you actual use that has been submitted by the phones using the network.)
| Accuracy | Ease of Use | Underlying Map | Ability to Select Device | 5G Coverage | |
| T-Mobile | 6 | 7 | Moderate | No | Simple |
| Sprint (now T-Mobile) | 8 | 6 | Detailed | Yes | Simple |
| Verizon | 6 | 8 | Simple | No | Separate Detailed Maps per City |
| AT&T | 5 | 7 | Simple | No | Simple |
it is important to note that good coverage doesn’t always mean good performance, nor does it mean a fast data connection. Furthermore, the maps typically show what coverage is like outdoors, not indoors. Thus, even with accurate maps, your cellular and data performance may suffer when you go indoors. Lastly, in terms of total actual coverage across the US, Verizon and AT&T simply have more complete and extensive coverage although T-Mobile is quickly catching up with their 600MHz expansion over the last 2 years. So if you travel a significant amount, especially in smaller towns or rural areas, go with Verizon for reliable coverage. However, if you pretty much work in one place and live in another, the accuracy of site-specific coverage maps is more important.
It is also important that while the maps may show strong vs. weak coverage, none of the maps show the amount of capacity that the network has at a given location. Accordingly, while there may be excellent coverage at a location, if there are too many people using the network simultaneously (think AT&T’s network in NYC after the first iPhone came out) the data speeds will drop and connectivity will become more problematic. In other words, at this point in time, none of the maps accurately show network capacity, although areas with 5G coverage will be more likely to handle greater capacity. However, that doesn’t necessarily mean faster speeds. (See this comparison by Open Signal– T-Mobile easily has the widest 5G coverage area- but Verizon’s average speed across their network is still higher even with the lowest 5G availability.)
So what can the average wireless consumer take from this?
- Wireless carrier coverage maps should only be used as a starting place. Do not decide which carrier to subscribe to based solely on coverage maps.
- Test your phone in your office and home before committing to a long-term agreement. Each of the WSPs allows a specific amount of time to return the phone after the date of purchase and cancel the service (usually 30 days). Ask your carrier about this prior to committing.
- Consumer Reports, RootMetrics, and PC Magazine have conducted independent studies on each of the Big 4 using empirical data to determine the quality and speed of service. Ranked results often show carrier performance by city and/ or geographical location.
- There are multiple sources that purport to provide crowd-gathered wireless coverage maps. These include www.opensignal.com and www.sensorly.com. While these maps can be helpful in confirming strong coverage, the lack of strong coverage could simply mean that the website didn’t receive adequate data to determine strong coverage. Thus, false negatives may apply.
- Do not rely upon 5G coverage maps as an indication of how fast your 5G service will be at a specific location. Other than Verizon’s 5G maps (which are hard to find and access) which show only mmWave 5G (the fastest type), the other carriers are blending 5G on their maps to include all types of 5G including low band (slowest 5G), mid-band (moderate 5G), and mmWave (fastest 5G).
Feel free to let us know if you have any comments or comments!

23 thoughts on “We Assessed the Accuracy of Wireless Coverage Maps per Carrier, and the Results Disappoint”
Incorrect about Sprint. You can in fact choose the device for which to see coverage. I was interested in this article but now I doubt its trustworthiness. 🙁
You are correct- we will modify our post to include this. As an FYI, I did test the website and the various devices. In a spot check of 10 devices, selecting them did not change the map at all.
On Sprint’s coverage map, you do have the ability to select a device.
Select the iPhone 5, Note 4, and Note 5 – All will generate different coverage maps.
Most of Sprints devices fully support all three LTE bands and should show little to no difference in coverage. Their older devices will support the B25 LTE network and is the main part of Sprints LTE network.
T Mobile still has a lot of devices that don’t support their longer range B12 LTE network and you will more likely see wider range in their LTE coverage.
Thank you for pointing this out.
The Verizon map is a representation of general coverage not strength as your article states incorrectly. Red=expected coverage. In addition, you represent people wanting to rent/sell land to cell companies, so you can’t be uninfluenced by the money associated with this. So you cannot be unbiased, and notingly, you ranked #2 @ #1 cell companies last. Hope you don’t get sued.
Nonetheless, we don’t believe that the Verizon map is accurate even for general coverage. Secondly, we don’t represent any landowners wanting to rent/sell land to cell companies- only those that have already been approached. Our clients already have leases before they come to us- so we aren’t influenced by money associated with coverage maps at all.
I just bought a new cellphone and my service is bad, I live in S.C.zipcode 29461. I live between Gooes Creek S.C.& Moncks Corner S.C.on Cypress Gardens road,Pimlico Plantation Subdivision.We do not have a cell tower out here,we need one or I’ll have to go back to my old carrier. I have great service while in towns that have towers. Please look into getting a cell tower out here. I have friends out here that also complain about their service with AT&T. We need a cell tower in our area and soon,please !
I find it interesting that if you call to report coverage issues to at least 2 of these entities, they will constantly shift any blame of coverage problems away from them. After significant time spent rebutting there displacement they will generally admit they have limited coverage. Recently, one of those entities, after much discussion (many calls) they indicated I am in a limited coverage area even thought their customer accessible map shows different.
In my experience in my home/work area, I agree that for 2 of these major carriers, their map is inaccurate. Many may even consider it fraudulent.
I live at 18 little island road Orrs island Maine in the town of harpswell. There is absolutely no cell phone coverage at this location but all cell phone companies say there is coverage. All my neighbors have atnt micro-cell hooked to there internet to use cell phones. Don’t understand how all maps show coverage but there is none.
The maps just aren’t that accurate. Furthermore, they tend to show outdoor coverage- not indoor coverage which will always be lower than outdoor.
Thanks you for this excellent article. I was reviewing Tmobile to consider switching to them from Verizon and their map seemed excellent and detailed. Then I checked Verizon's map for some rural areas I frequent and it just struck me as imposible! You thoroughly confirmed my strong suspicions that Verizon's map is mostly marketing. While Tmobile's mapping seems much more based on their actual radio readings, Verizons is just a bunch of BS. Tmobile here I come!
AT&T coverage claims are a total lie. I bought a prepaid plan specifically owing to their coverage promises – yet less than 1/3 of my trip (WA OR CA NV UT CO WY MY) has coverage. This was NOT isolated areas “owing to the odd tower outage”, I had zero service for hundreds of miles in areas where their map showed solid blue or even green. Basically, I had no reliable service anywhere outside cities, despite being in well populated tourist areas (Yellowstone, Zion, etc). I have a new iPhone, and to add insult to injury, our other phone with a Canadian SIM card (data off), often picked up Verizon or TMobile in those areas. AT&T – scammers!!!!
Every so often I revisit this issue for our Verizon service. We are located in a WA canyon, midway up, with no cell reception adequate for a call w/some times a text receipt. We have a clear view of Mt. Adams at 25 miles to the NW. A tower would hit us perfectly even with the contour. Our location shows 4g but un-uh, no way. In fact, our only connection is with a booster on the roof which hits a CellularOne tower with 1x data and enough bars to carry a conversation if everyone is patient within 5 ft of the booster.
A bit back I upgraded the zBoost to include 4g plus all bands. It was a wasted effort as it performed lower, i.e., nothing with a directional antenna.
I’m not unsympathetic – there just aren’t that many subscribers/users in this area to merit a tower but the accuracy of the map is marketing hype.
Hi- thank you for this response. I think this very adeptly addresses the issue of coverage maps. The issue always that there should be a tower- but that the coverage maps should accurately reflect the lack of coverage if there isn’t.
I just got off a call with T-mobile and they refuse to update coverage maps based on my, repeated experiences on their network or admit that they could be wrong. What can be done about this?
I live in Reno. T-Mobile is sketchy all over the valley. Traveled to Maryland-Virginia-North Carolina and T-Mobile’s coverage was all but non existent along the Western shore and northern North Carolina shore. I needed to find WiFi to use my navigation.
Back in the late 1980’s, realtors at a convention argued what’s most important to buyers. I said cell phone reception will be huge in the future. I was laughed at.
The Sprint map does change when I change devices. And it is fairly accurate. I can’t figure out how to select a device on the t mobile map though. I do know that I’ve never seen a t mobile phone work at my address, but their map says excellent coverage.
Tried T-Mobile Internet. Map indicates “5G Ultra Capacity” in my area. I’m less than two miles from the tower as the crow flies with no obstructions. Was lucky to get two bars on the 5G receiver. 20mbps in spurts, but 1.4-5mbps most of the time. What a lie.
Sensorly.com no longer exists.
T-Mobile coverage map is a total lie. Says 5G yet I go for days with no service at all. They said it’s a bad SIM and they’d send a replacement, then they shipped it to the wrong address! I wrote a letter to FCC with screenshots of T-Mobile’s map and ridiculously poor Ookla speed test (when I do occasionally have service best was 1.12 up and 0.13 down – should be 30’s-50’s down and maybe 20’s-30’s up if really 5G) Then a T-Mobile “executive” started harassing me threatening to shut me off. Boycott T-Mobile!